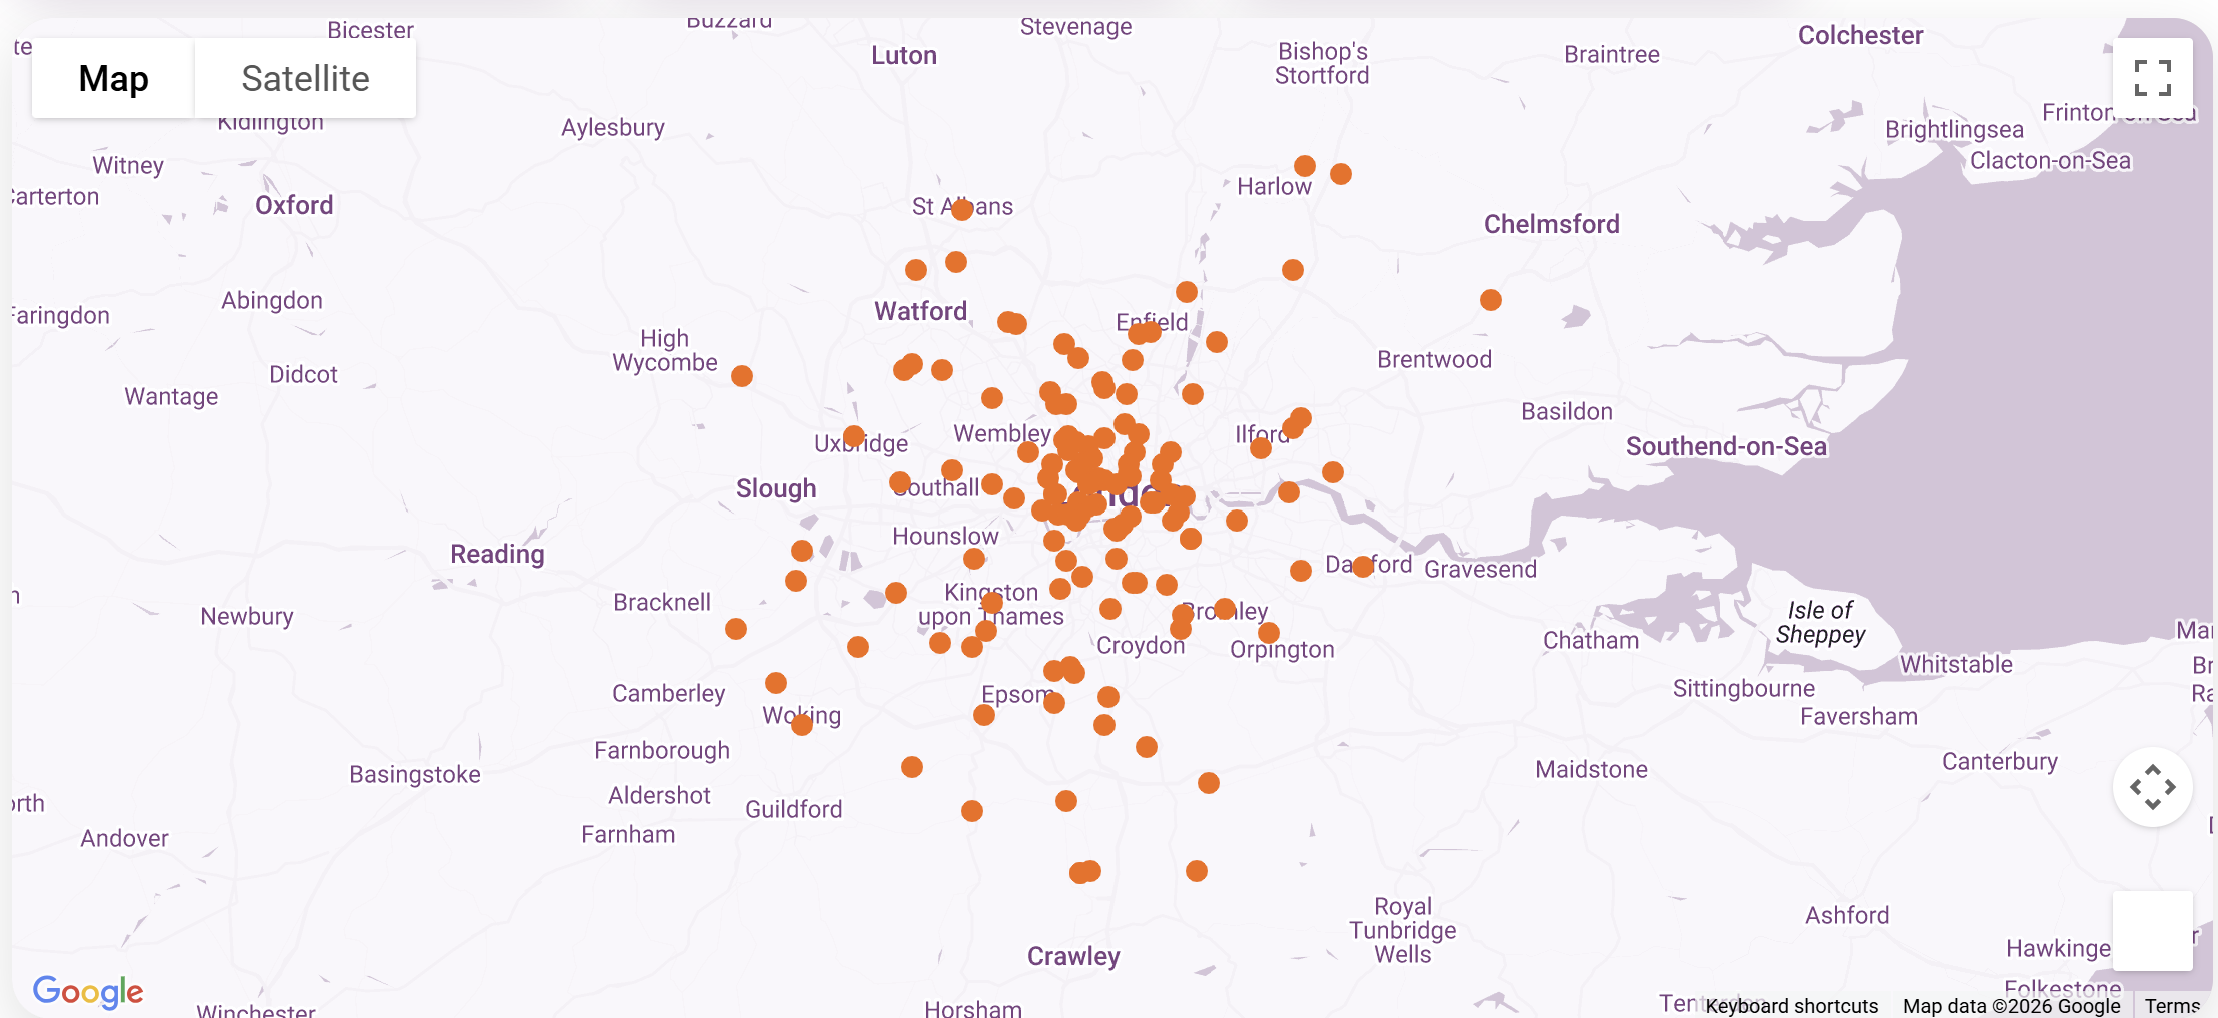

Block movement trends
Below are our estimates of the blocks that have moved to new block managers as of: 2026-06-01
The first graph shows how many blocks moved per year over the past 10 years, followed by the number of blocks moved per month over the past 12 months.
Blocks moved per year
Showing the last 10 years from 2017 to 2026.
Total blocks moved
67,345
Highest year
2024
Highest annual total
7,700
| Year | Blocks moved |
|---|---|
| 2017 | 7,145 |
| 2018 | 7,675 |
| 2019 | 6,775 |
| 2020 | 6,345 |
| 2021 | 7,375 |
| 2022 | 6,745 |
| 2023 | 7,105 |
| 2024 | 7,700 |
| 2025 | 7,000 |
| 2026 | 3,480 |
Blocks moved per month
Showing the latest 12 months available in the data.
Total blocks moved
6,680
Highest month
Jan 2026
Highest monthly total
875
| Month | Blocks moved |
|---|---|
| Jun 2025 | 515 |
| Jul 2025 | 585 |
| Aug 2025 | 460 |
| Sep 2025 | 610 |
| Oct 2025 | 605 |
| Nov 2025 | 470 |
| Dec 2025 | 425 |
| Jan 2026 | 875 |
| Feb 2026 | 570 |
| Mar 2026 | 535 |
| Apr 2026 | 555 |
| May 2026 | 475 |
0
Portfolio blocks verified
0
Blocks registered
0
Block managers registered

Get in touch
More JuxtaBlock data
See the top block managers near you