Right to manage monthly report
Right-to-Manage (RTM) arrangements continue to grow strongly – with an average month-on-month growth of 4% over the past 3 years.
There has been an even higher growth of the total number of company structures set up to manage new estates and apartment buildings – every year over 5,000 of these are now created
For the past year, these RTMs have been clustered around the Southeast as has been the norm over the past 10 years. The growth in the Southeast is increasingly out-stripping all other locations across the UK.
Estimated number of new blocks and single-managed estates started in the UK since 2004

Estimated number of RTMs created in the UK since 2004

The number to RTM arrangements have grown strongly since 2004, with an average year-on-year growth rate of 9%. Now every year sees over 1,000 new buildings taking out a new RTM arrangement.
Over this time, the number of new developments of all ownership types has also grown strongly apart from the years around 2008, during the financial crisis. Since 2015, the number of new developments starting has increased by 25% per year.
There is some evidence that the 2008 recession saw a jump in RTMs - possibly due to leaseholders wishing to control and reduce their service charge costs. It is possible that a similar jump has occurred over the past 2 years as reducing capital growth has encouraged leaseholders to take out RTMs - to control their costs and improve their properties. In addition, the recent publicity around the ground rent scandals may have encouraged more leaseholders to apply for an RTM arrangement.
Number of RTMs created per month over the past 3 years
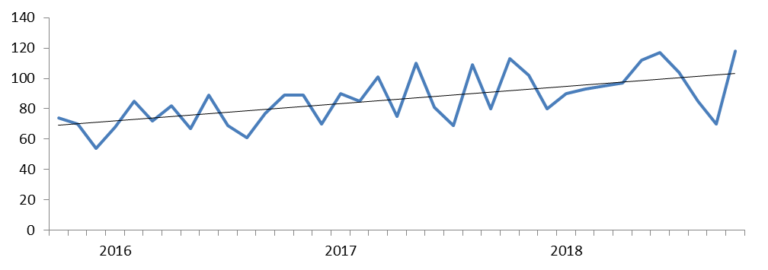
Over the past 3 years, the month-on-month growth has been at around a very healthy rate of 4%. However, the month-to-month values are highly variable and the maximum number of arrangements which are legally possible in the UK is unclear.
Given that RTM arrangements will take on average from 3-6 months to complete, peaks may often be down to issues that occurred within the previous year.
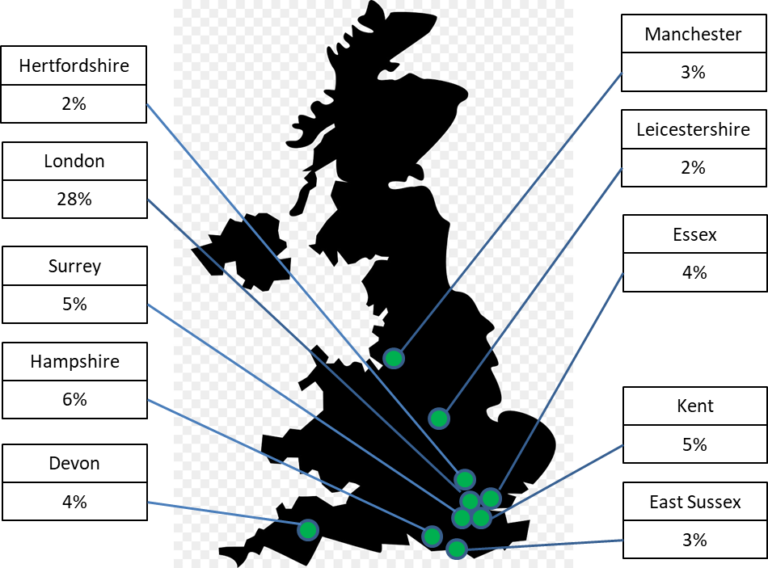
Distribution of RTMs across country over the past year
Distribution of RTMs across country over the past 10 years
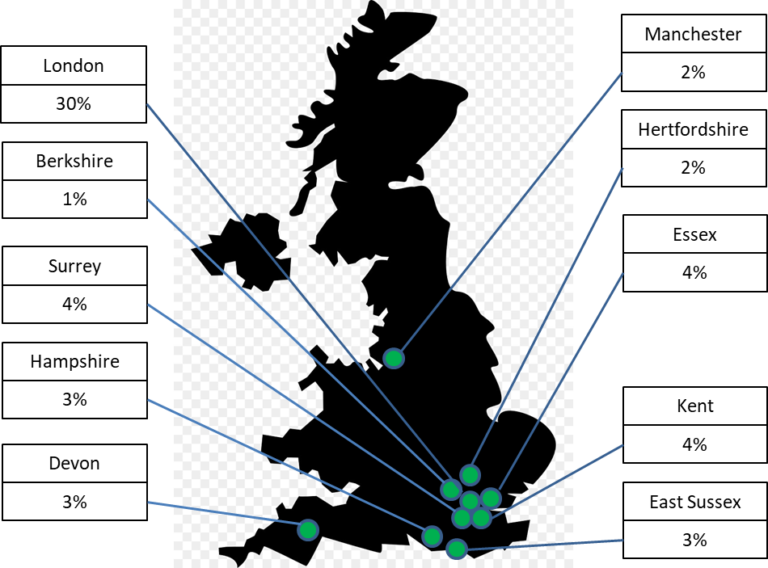
London has The historically created around 30% of new RTMs and over the past year this has reduced slightly. In total, the Southeast represents over 50% of RTMs created over the past 10 years and this trend looks likely to continue.
Outside of the Southeast, Hampshire and Devon represent the second and third largest areas for RTMs. The growth in Hampshire over the past year has been particularly marked, at a rate of 6%
Manchester and Birmingham produce surprisingly few new RTM arrangements, with Manchester only just making it into the top 10 areas in the UK.
Historical datasets
Methodology
We use a number of data sets generated from our operations and public records in order to create initial estimates and verify our analysis. If you would like to discuss this further, please get in touch at data@juxtablock.com