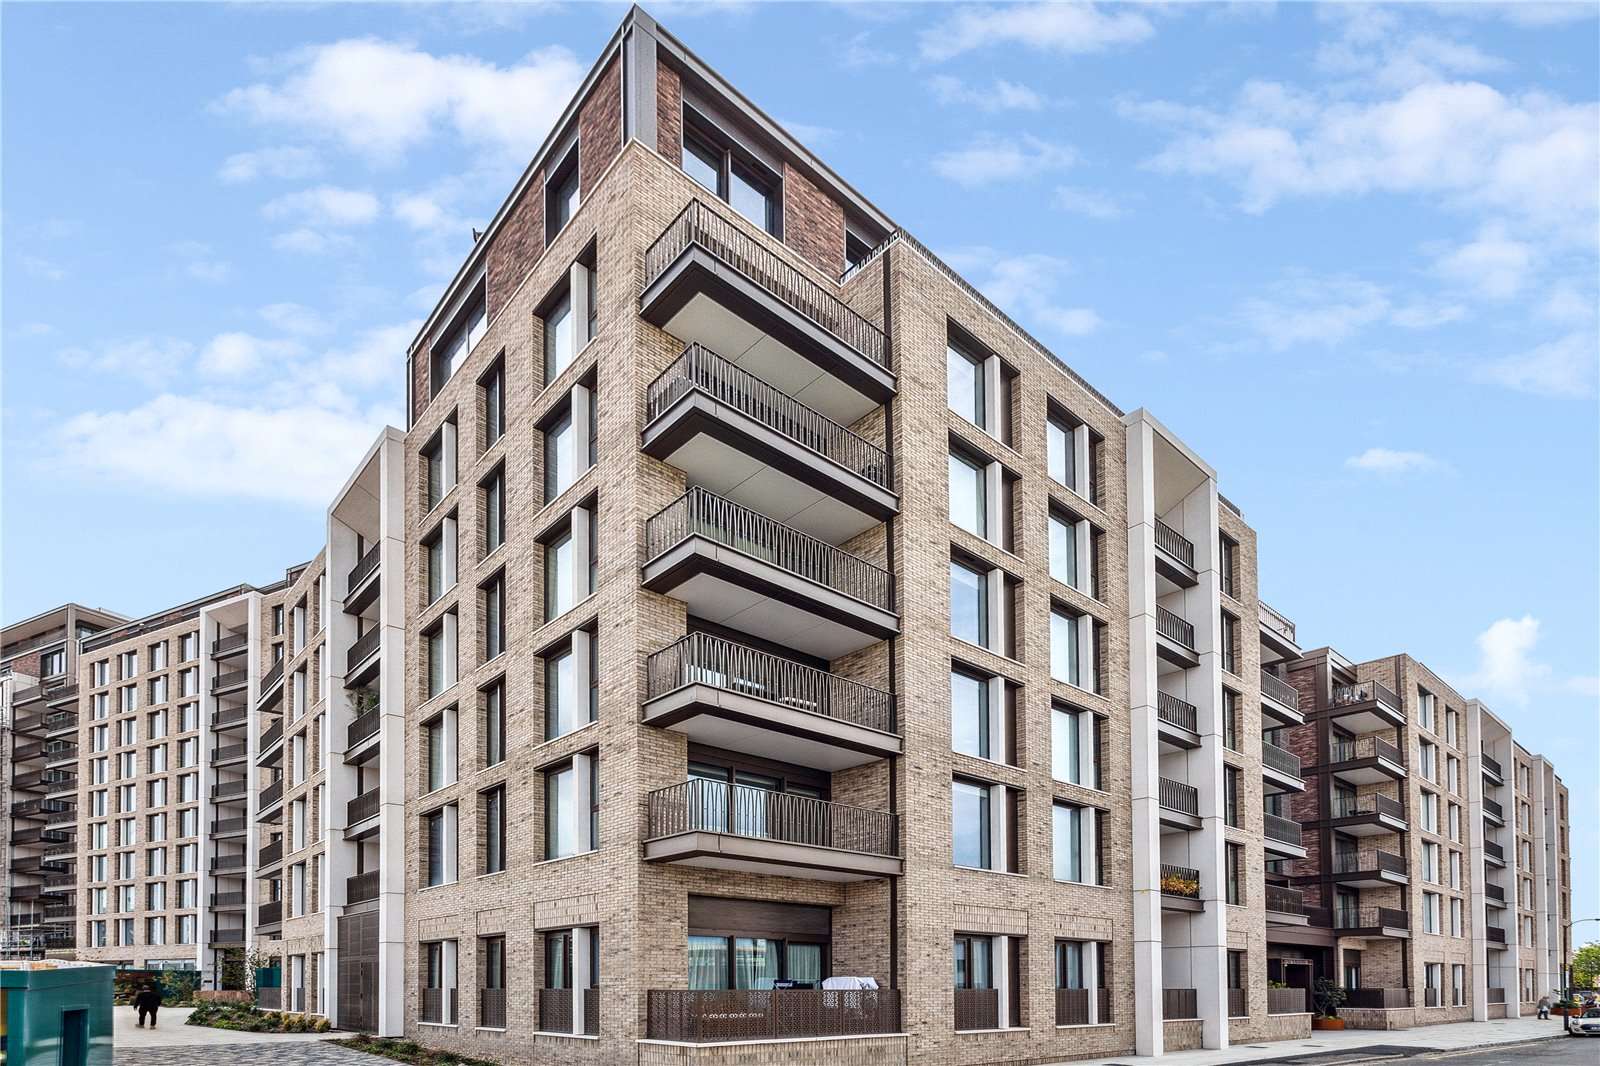
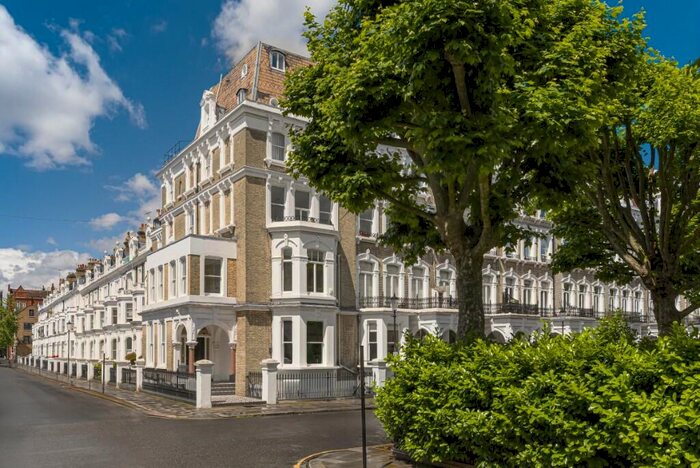
Best Apartment Blocks in Fulham

Hampton House
Location:
SW6 2RL
Apartments in building:
40
Est ppsqm:
£16,900

Pound Court
Location:
SW6 1BN
Apartments in building:
10
Est ppsqm:
£32,700

7 Dancer Road
Location:
SW6 4DU
Apartments in building:
6
Est ppsqm:
£13,100
Our analysis of this market
The article discusses the best apartment blocks in Fulham and provides an analysis of market trends from 2018 to 2023. While apartment sales increased by 13%, average prices dropped by 4%. The article also highlights significant variations in price per square meter across various roads, with some areas like Bagleys Lane seeing growth of 241%, while others, such as Colehill Lane, experienced a 46% decline. The performance varies considerably between different streets and buildings in the area.
Overall performance of apartments in Fulham
Between 2018 and 2023, the number of apartment sales in Fulham increased by 13%, rising from 588 in 2018 to a peak of 821 in 2022 before slightly declining to 664 in 2023. Despite the rise in sales, average apartment values dropped by 4%, starting at £808,200 in 2018, reaching a high of £849,600 in 2020, and then falling to £779,900 in 2023. This reflects a dynamic market with growing sales but declining property values over the period.
Relative performance of area in Fulham
The data shows significant variations in price per square meter (ppsqm) across different roads in Fulham from 2018 to 2023. Roads like Bagleys Lane and Niton Street saw the largest increases, with growth of 241% and 194%, respectively. In contrast, Colehill Lane and Radipole Road experienced the steepest declines, both falling by 46%. Other notable rises include Oxberry Avenue (144%) and Central Avenue (135%). Overall, the market displayed mixed performance, with some roads experiencing dramatic growth and others seeing significant decreases.
Latest data
| Year | Number of apartment sales | Average apartment value |
|---|---|---|
| 2018 | 588 | £808,200 |
| 2019 | 635 | £728,400 |
| 2020 | 731 | £849,600 |
| 2021 | 795 | £716,900 |
| 2022 | 821 | £784,200 |
| 2023 | 664 | £779,900 |
| 13% | -4% |
| Road | ppsqm 2018 | ppsqm 2023 | Growth |
|---|---|---|---|
| COLEHILL LANE | 12059 | 6562 | -46% |
| RADIPOLE ROAD | 10704 | 5830 | -46% |
| PARSONS GREEN LANE | 20125 | 12031 | -40% |
| HALFORD ROAD | 14279 | 8892 | -38% |
| BOLANDER GROVE | 18553 | 12402 | -33% |
| FULHAM HIGH STREET | 10738 | 7422 | -31% |
| LILLIE SQUARE | 21636 | 15137 | -30% |
| FULHAM ROAD | 11556 | 8360 | -28% |
| ROWALLAN ROAD | 12025 | 8654 | -28% |
| STATION COURT | 5246 | 3867 | -26% |
| BROUGHTON ROAD | 11735 | 8876 | -24% |
| WANDSWORTH BRIDGE ROAD | 9727 | 7525 | -23% |
| TAMWORTH STREET | 9418 | 7582 | -19% |
| GLENROSA STREET | 11031 | 9197 | -17% |
| WALDEMAR AVENUE | 8312 | 7011 | -16% |
| BYAM STREET | 8780 | 7660 | -13% |
| GIRONDE ROAD | 13926 | 12515 | -10% |
| LILLIE ROAD | 9258 | 8311 | -10% |
| BRONSART ROAD | 11405 | 10398 | -9% |
| VERA ROAD | 9629 | 8776 | -9% |
| HURLINGHAM ROAD | 10369 | 9413 | -9% |
| LILYVILLE ROAD | 13191 | 12255 | -7% |
| STEPHENDALE ROAD | 9373 | 8748 | -7% |
| ROSTREVOR ROAD | 13415 | 12612 | -6% |
| COLUMBIA GARDENS | 15816 | 14851 | -6% |
| PARSONS GREEN | 11312 | 10690 | -5% |
| WILLIAM MORRIS WAY | 9022 | 8530 | -5% |
| EPIRUS ROAD | 10558 | 10139 | -4% |
| LAMBROOK TERRACE | 8130 | 7816 | -4% |
| THE BOULEVARD | 9936 | 9553 | -4% |
| CRANBURY ROAD | 10023 | 9722 | -3% |
| TYNEMOUTH STREET | 7961 | 7816 | -2% |
| FULHAM PALACE ROAD | 8548 | 8418 | -2% |
| WYFOLD ROAD | 10146 | 10004 | -1% |
| ATALANTA STREET | 9403 | 9535 | 1% |
| CARNWATH ROAD | 8960 | 9015 | 1% |
| BROMPTON PARK CRESCENT | 9825 | 9933 | 1% |
| SHORROLDS ROAD | 11085 | 11533 | 4% |
| BISHOPS PARK ROAD | 9757 | 10311 | 6% |
| RANELAGH GARDENS | 10226 | 10856 | 6% |
| BARCLAY ROAD | 10185 | 10895 | 7% |
| BURLINGTON GARDENS | 11096 | 11842 | 7% |
| HAMBLE STREET | 10964 | 11836 | 8% |
| MIRABEL ROAD | 8657 | 9547 | 10% |
| QUEENSMILL ROAD | 7968 | 8730 | 10% |
| LENSBURY AVENUE | 9874 | 10845 | 10% |
| TOWNMEAD ROAD | 9679 | 10833 | 12% |
| DAWES ROAD | 7493 | 8701 | 16% |
| WARDO AVENUE | 9335 | 10967 | 17% |
| MABLETHORPE ROAD | 9736 | 11390 | 17% |
| CROOKHAM ROAD | 8913 | 10503 | 18% |
| HARWOOD ROAD | 9927 | 11710 | 18% |
| BRITANNIA ROAD | 9639 | 11508 | 19% |
| WHITTINGSTALL ROAD | 5081 | 6318 | 24% |
| EDENVALE STREET | 9006 | 11289 | 25% |
| DANEHURST STREET | 6926 | 8759 | 26% |
| DE MORGAN ROAD | 8230 | 10517 | 28% |
| MALTINGS PLACE | 8231 | 10824 | 32% |
| OAKBURY ROAD | 7245 | 10094 | 39% |
| MUNSTER ROAD | 6883 | 9595 | 39% |
| ACKMAR ROAD | 11200 | 16635 | 49% |
| NEW KINGS ROAD | 7030 | 10568 | 50% |
| PROTHERO ROAD | 8905 | 15058 | 69% |
| HOMESTEAD ROAD | 7045 | 12101 | 72% |
| TOURNAY ROAD | 9237 | 20219 | 119% |
| DAIRY CLOSE | 4219 | 9838 | 133% |
| CENTRAL AVENUE | 6116 | 14377 | 135% |
| OXBERRY AVENUE | 5851 | 14297 | 144% |
| NITON STREET | 2755 | 8112 | 194% |
| BAGLEYS LANE | 3138 | 10711 | 241% |
Comments are closed.

