Managed Buildings with Increasing Demand
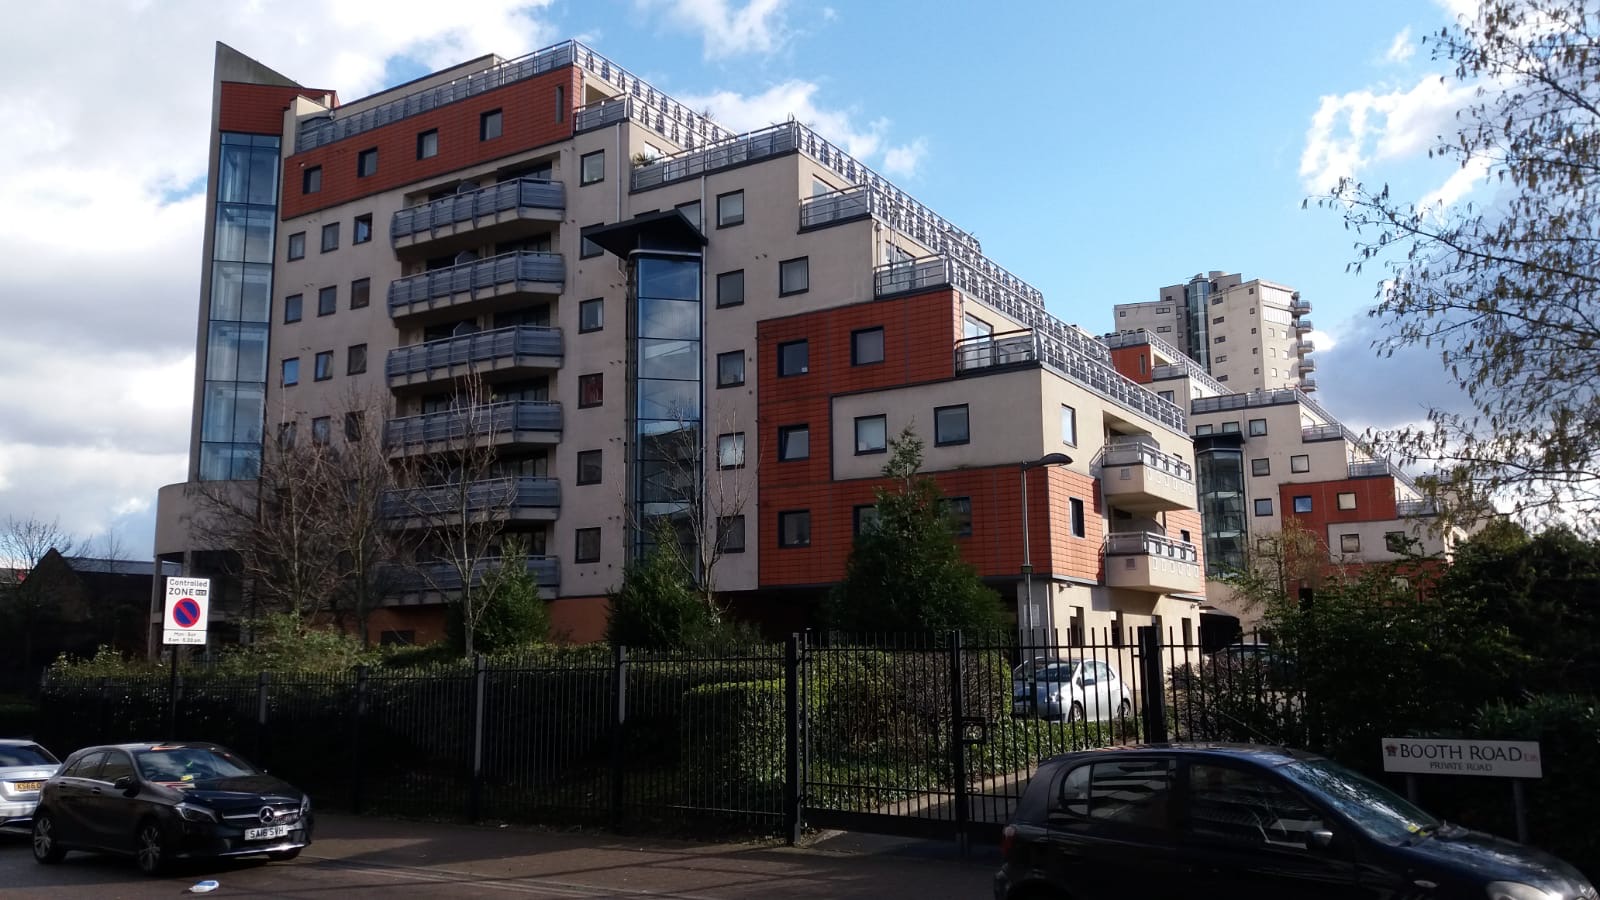

Tradewinds
Growth Above E16 Area
+1.0%
Time Managed
12 Years 6 Months
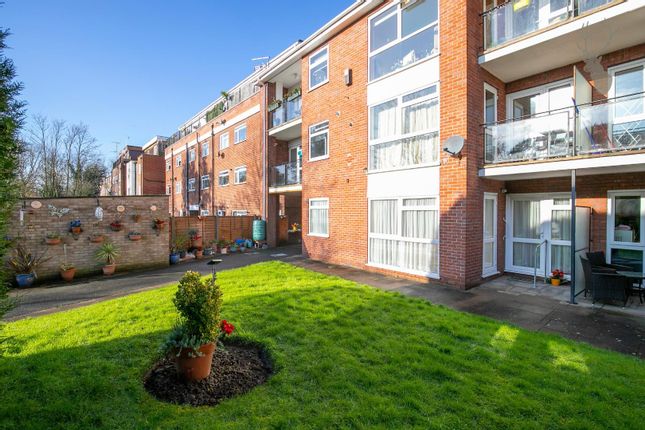
Stonehill
Growth Above E4 Area
+0.3%
Time Managed
12 Years 9 Months
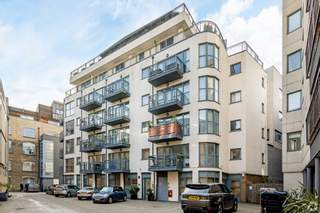
Colour House
Growth Above SE1 Area
+3.1%
Time Managed
9 Years 5 Months
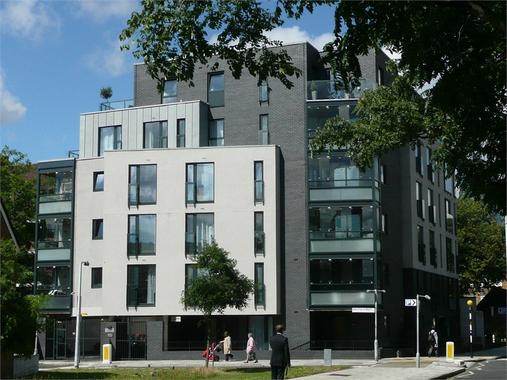
Tangerine House
Growth Above SE1 Area
+3.8%
Time Managed
15 Years 2 Months

1a, Hayfield Passage
Growth Above E1 Area
+9.9%
Time Managed
8 Years 0 Months
Growth Above Area
Time Managed
0 Years 0 Months