
Best Apartment Blocks in Hull
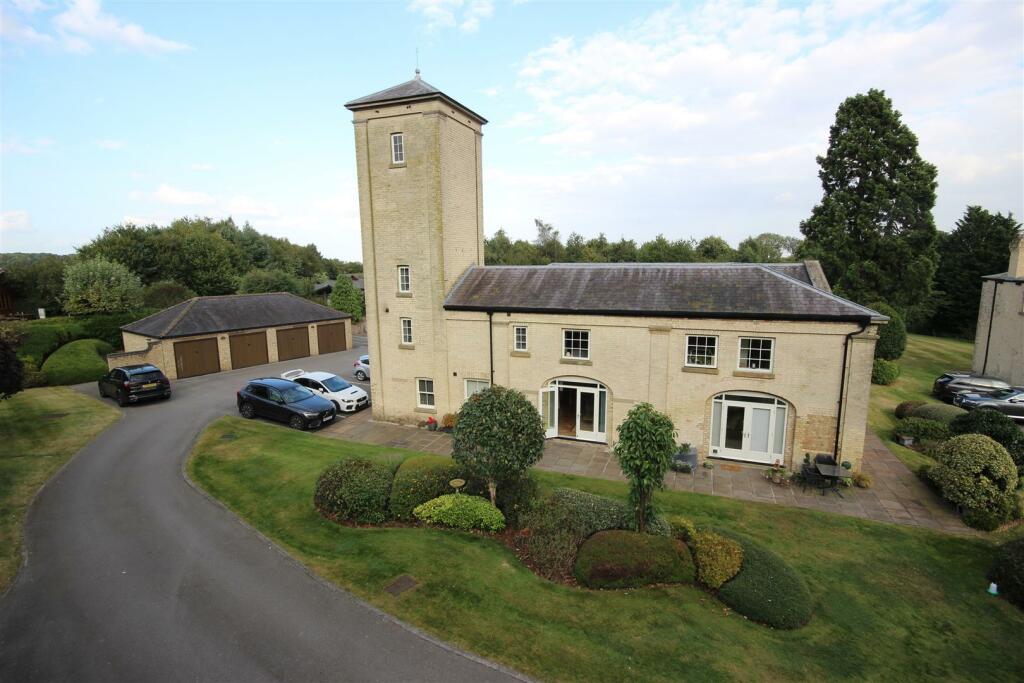
The Stables
Location:
HU16 5WH
Apartments in building:
6
Growth:
43%
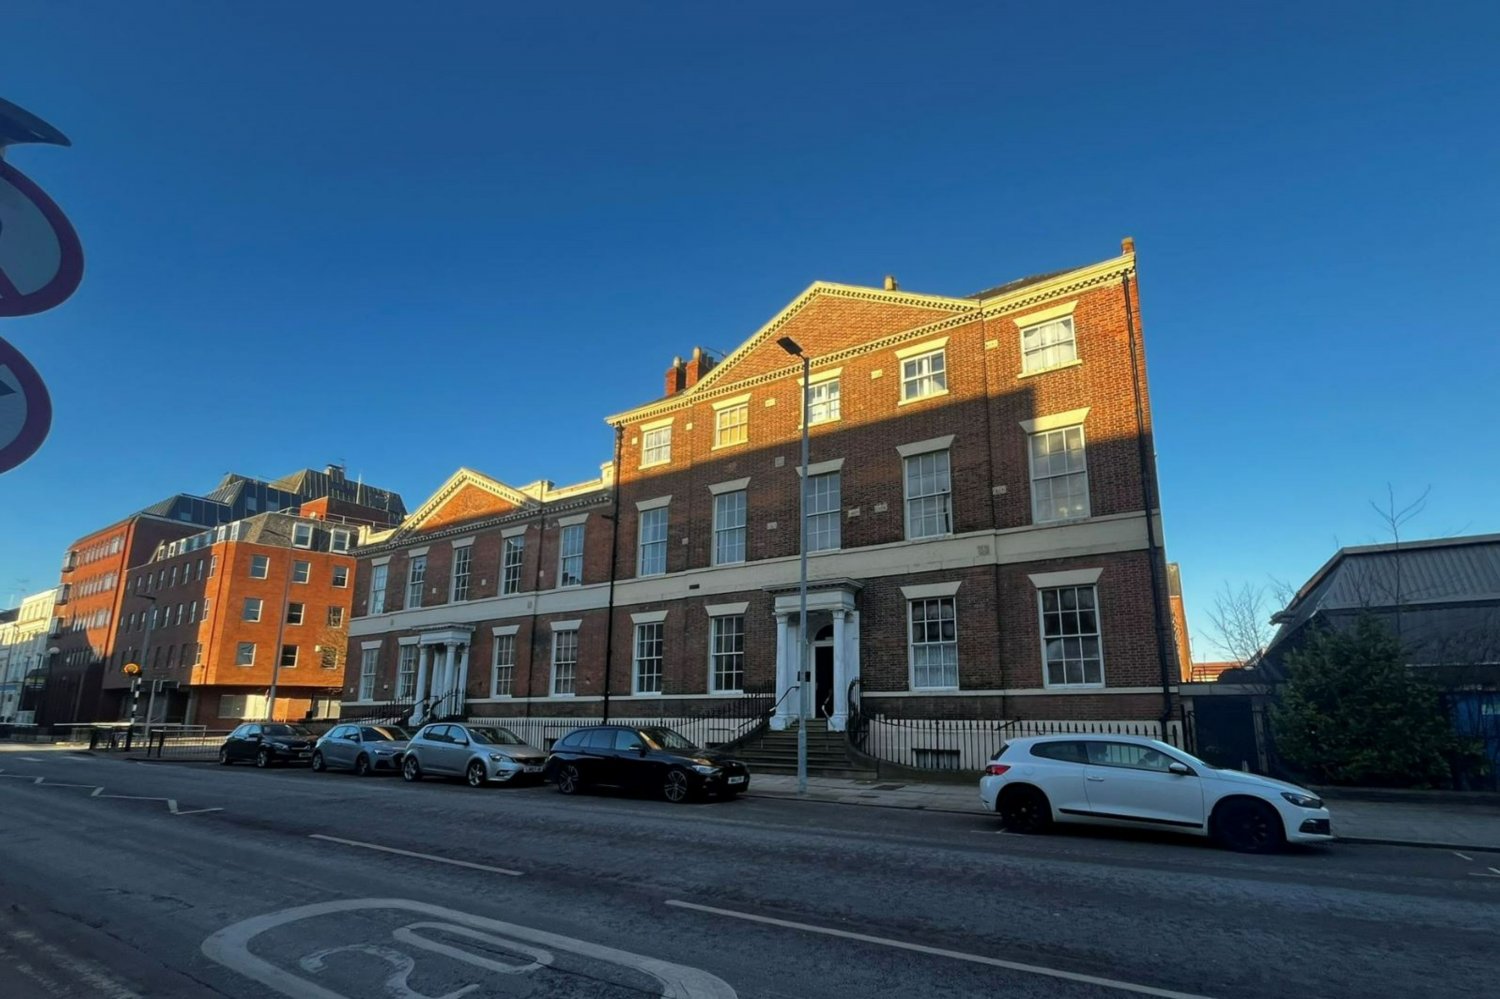
85 George Street
Location:
HU1 3BN
Apartments in building:
10
Growth:
94%
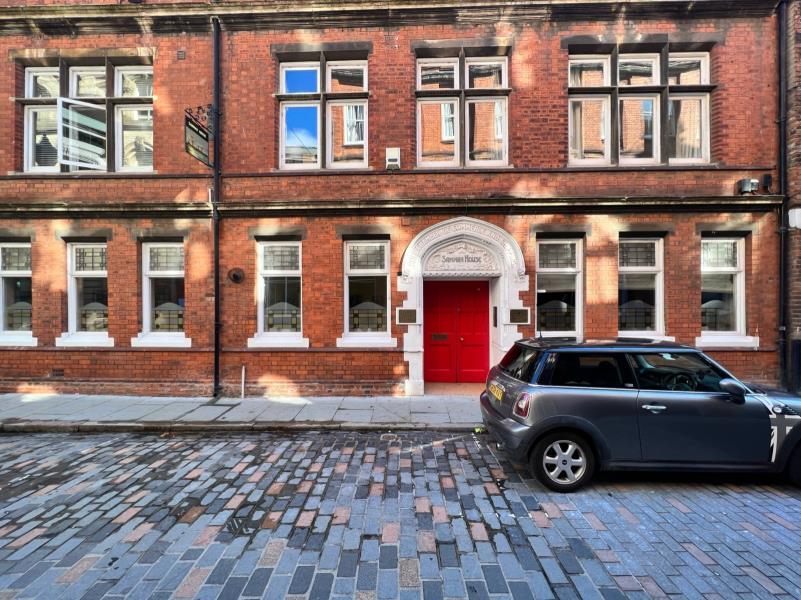
Samman House
Location:
HU1 1XR
Apartments in building:
10
Growth:
74%
Our analysis of this market
We have reviewed the prices of apartment in Hull of the 5-year period from the years 2018 to 2013. We were looking to understand how demand has changed in specific locations and overall in the City.
In addition, we are trying to find the best managed apartment blocks which are the most in demand.
In addition, we are trying to find the best managed apartment blocks which are the most in demand.
Overall performance of apartments in Hull
The chart shows the number of apartment sales and average apartment values from 2018 to 2023. Apartment sales fluctuated, peaking in 2022 at 694 sales and hitting a low in 2020 with 414 sales. The average apartment value increased from £94,752 in 2018 to £125,333 in 2022, with a slight drop to £116,127 in 2023. Over the six years, apartment sales decreased by 12.4%, while average apartment values rose by 22.6%.
Best peforming area in Hull
The data compares property prices per square meter (ppsqm) between 2018 and 2023 across various postcodes in Hull. Notable increases were seen in HU1 (up 69%) and HU13 (56%), while decreases occurred in HU18 (down 18%) and HU9 (down 16%). Most areas saw slight positive changes, indicating stable or increasing property values over the five-year period.
Latest data
| Year | Number of apartment sales | Average apartment value |
|---|---|---|
| 2018 | 516 | £94,752 |
| 2019 | 591 | £125,402 |
| 2020 | 414 | £110,054 |
| 2021 | 680 | £121,312 |
| 2022 | 694 | £125,333 |
| 2023 | 452 | £116,127 |
| -12.4% | 22.6% |
| Postcode District | ppsqm 2018 | ppsqm 2023 | Growth |
|---|---|---|---|
| HU10 | 1544 | 1855 | 0.2 |
| HU18 | 2191 | 1800 | -0.18 |
| HU8 | 1349 | 1495 | 0.11 |
| HU3 | 698 | 820 | 0.17 |
| HU2 | 1709 | 1590 | -0.07 |
| HU16 | 2119 | 2115 | 0 |
| HU13 | 1643 | 2560 | 0.56 |
| HU17 | 2317 | 2555 | 0.1 |
| HU1 | 1626 | 2743 | 0.69 |
| HU9 | 1669 | 1394 | -0.16 |
| HU4 | 1154 | 1512 | 0.31 |
| HU14 | 2047 | 2407 | 0.18 |
| HU12 | 1601 | 1596 | 0 |
| HU6 | 1242 | 1249 | 0.01 |
| HU11 | 1615 | 1812 | 0.12 |
| HU15 | 2173 | 2208 | 0.02 |
| HU7 | 1117 | 1517 | 0.36 |
| HU5 | 858 | 1380 | 0.61 |